Contents
Share
What is Lead time for Change in DevOps metrics?
What is lead time for change?
In times time-to-market often defines market winners, lead time for change is a strategic lever that engineering leaders can pull to drive real business outcomes. When lead time is short, teams release features quickly, respond promptly to user feedback, and seize opportunities before the competition. When it’s long, the organization risks missed deadlines, frustrated engineers, and dissatisfied customers.
This article focuses on why lead time matters to engineering executives, how it fits within the DORA metrics framework, and what tactics you can deploy to diagnose and fix bottlenecks. We’ll approach it from a leadership perspective, emphasizing ROI, talent retention, and overall DevOps performance metricsso you’ll walk away with insights on how to steer both your team and your stakeholders toward continuous improvement.
Understanding Lead Time for Change from a Leadership Lens
Defining Lead Time for Changes
For engineering managers and VPs of Engineering, lead time for changes represents the duration from code commit to successful deployment in production. It’s a direct measure of your organization’s agility: the faster you can move ideas into reality, the more quickly you can validate hypotheses, adapt to market shifts, and generate value for customers.
Some teams measure it from the moment a feature request is createdothers focus on the pipeline stage (commit-to-production). Whichever approach you use, consistency and clarity in measurement is key. Leadership should ensure everyone aligns on the definition, so metrics remain actionable.
Why It Matters
- Faster Time-to-Value
A short lead time means delivering new features or fixes at a pace that aligns with market demands. This not only improves customer satisfaction but also showcases the engineering team’s capacity to drive business outcomes quickly. - ROI and Cost Savings
When code waits in review or QA queues for days, you’re effectively burning engineering time with little output. Streamlined lead time reduces overhead, letting you channel resources into innovation and long-term value. - Stronger Team Culture
Long lead times often correlate with low moraleengineers dread endless approvals and environment issues. A smooth pipeline fosters a culture of ownership and continuous improvement, where victories (and learnings) are visible and frequent.
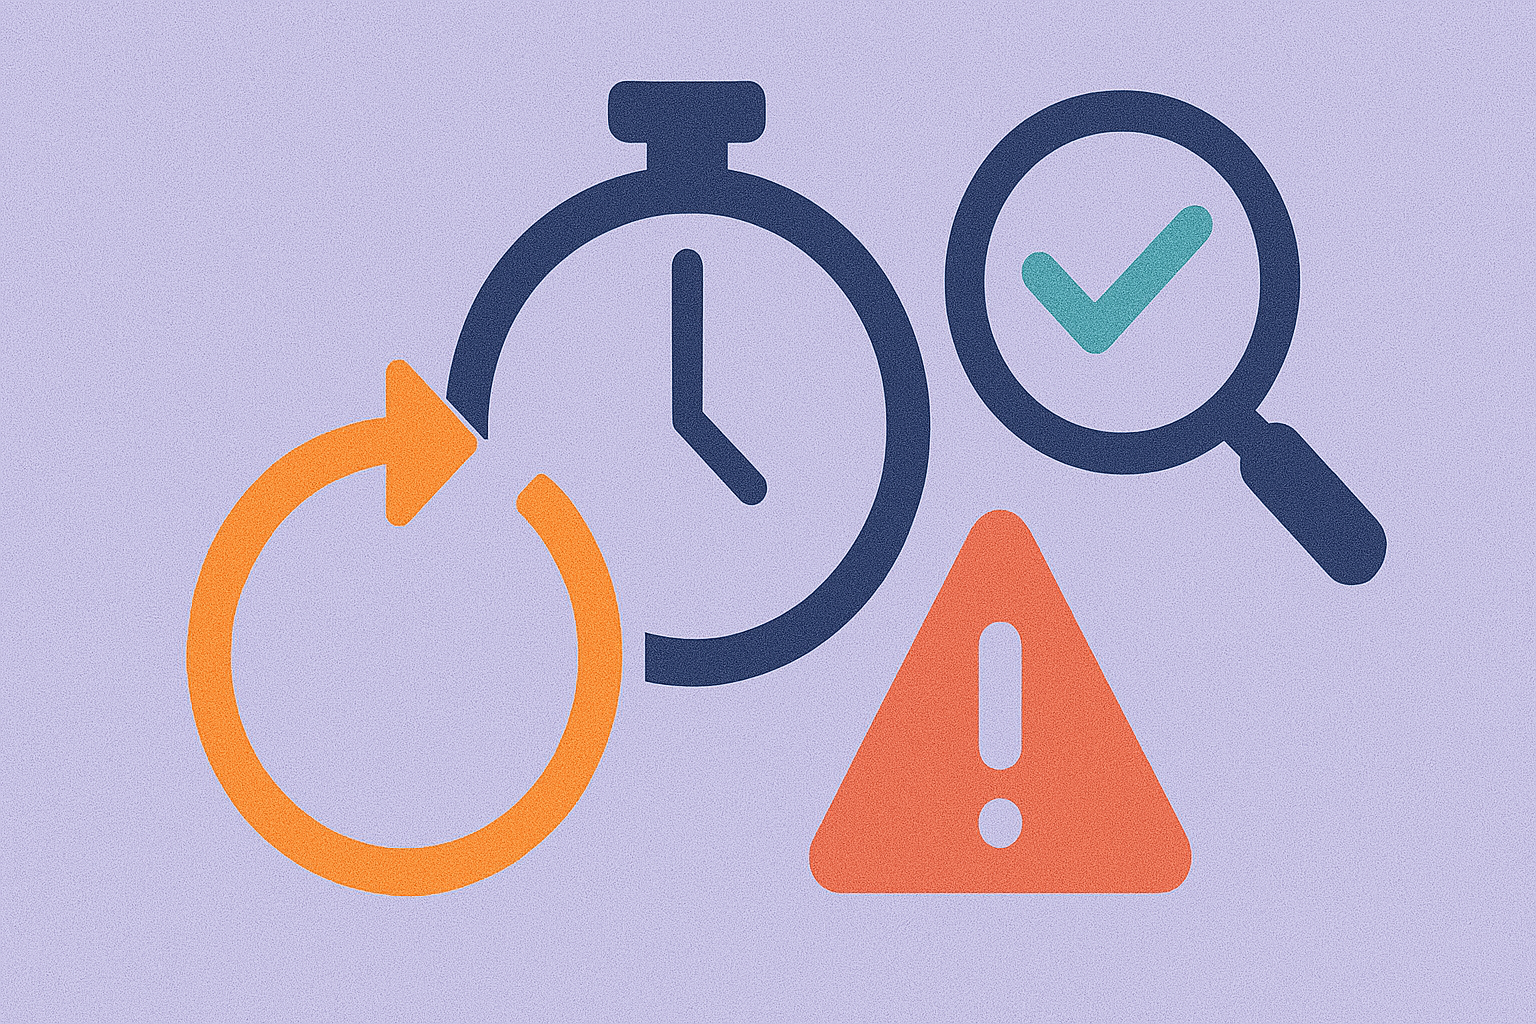
Relation to Other DORA Metrics
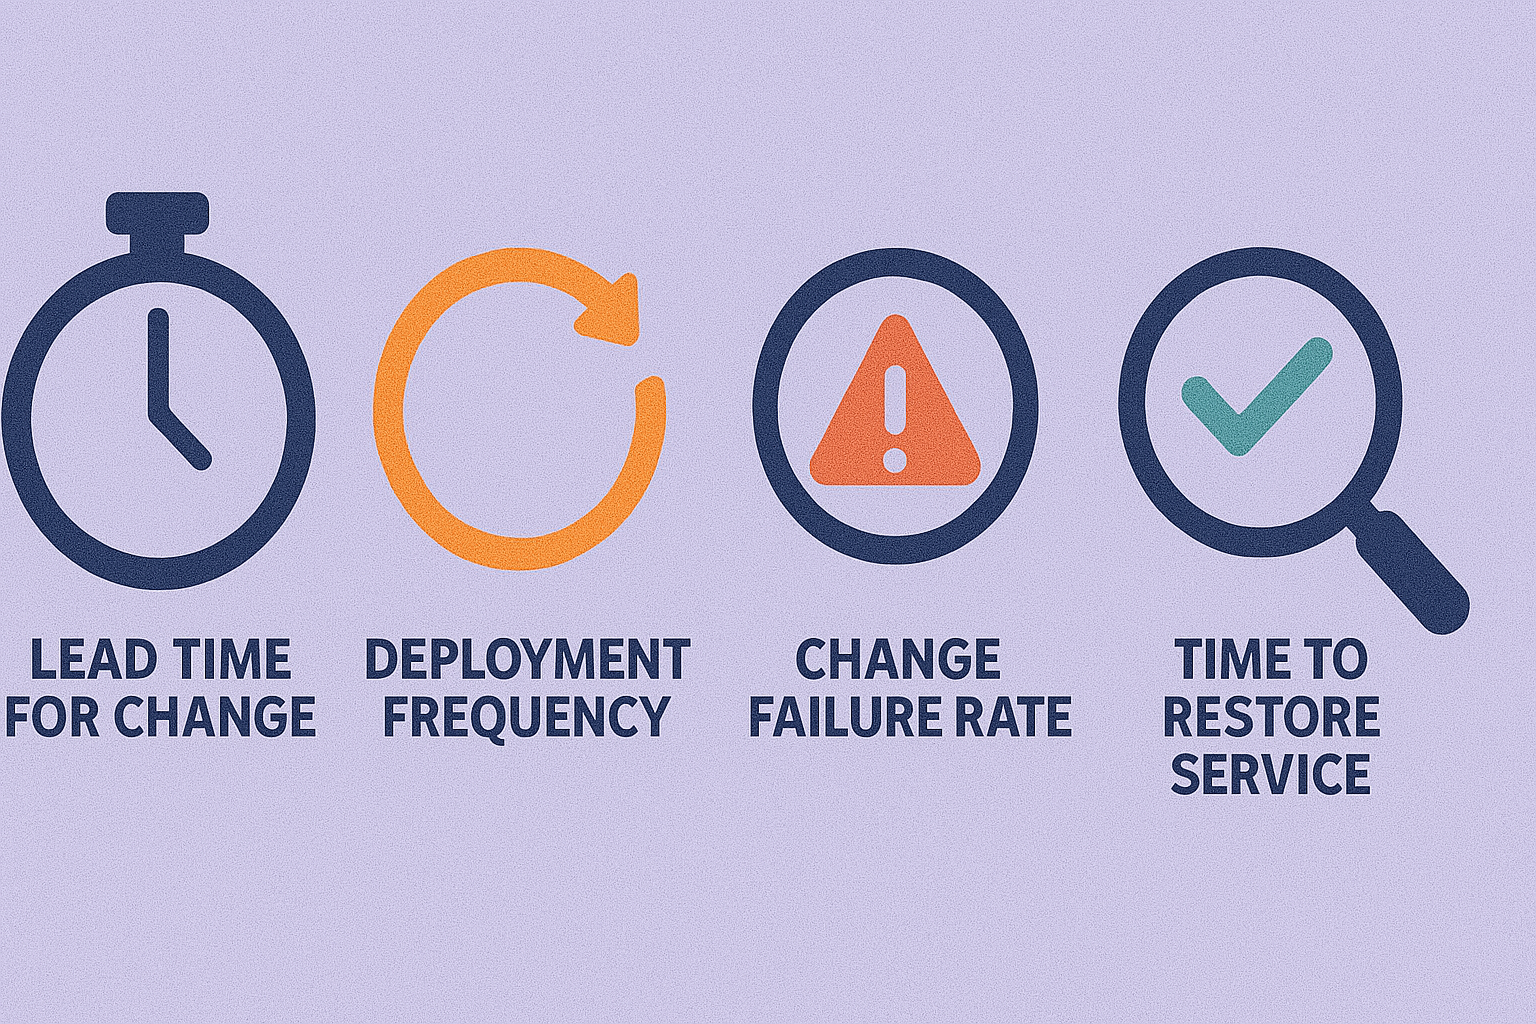
- Deployment Frequency: A shorter lead time often goes hand-in-hand with higher deployment frequency releasing smaller chunks of work more often, which is less risky and easier to maintain.
- Change Failure Rate: Frequent, smaller changes reduce the probability of large-scale failures; teams catch issues earlier and resolve them before they balloon.
- Mean Time to Recovery (MTTR): If your pipeline is efficient, time to recover from incidents decreases because teams can quickly roll back or patch the issue in production.
A Data-Driven Approach to Diagnosing Bottlenecks
Engineering leaders thrive on evidence-based decisions. To reduce lead time, you first need to know exactly where your pipeline slows down.
Common Bottlenecks at the Leadership Level
- Excessive Approvals & Bureaucracy
Multiple sign-offs, unclear ownership, or outdated governance processes can stall the pipeline. Streamlining decision-making often requires organizational change, not just new tools. - Insufficient Automation
Without CI/CD, teams resort to manual integration and testing, which is error-prone and slow. Investing in automation pays off over time through reduced operational overhead and fewer production incidents. - Siloed Dev, QA, and Ops Teams Separate backlogs and slow handoffs can cripple speed. Cross-functional “squads” or “pods” can break down these silos, aligning teams around shared goals.
- Under-Provisioned Infrastructure
Slow build times or limited staging environments can turn a quick fix into a multi-day ordeal. Justifying spend on scalable infrastructure (e.g., cloud-based test environments) can greatly accelerate your pipeline.
Diagnostic Tools & Techniques
- Value Stream Mapping: Visualize each stage (development, review, QA, etc.) and document how long tasks idle in each stage.
- DevOps Dashboards (e.g., GitLab, Jenkins, GitHub Actions): Identify average review times, build/test durations, and deployment steps. DevDynamics offers DORA Dashboard for completely visibility on your DevOps performance metrics.
- Collaboration Metrics: Measure how long requests sit in Slack or email threads without updates. This often reveals hidden “soft bottlenecks.”
Leverage these data points to rally executive teams. Concrete metrics, like “90% of code review requests are idle over 48 hours,” make a compelling case for process improvement or more resources.
Fixing Bottlenecks: Strategies for Leaders
1. Champion Automation & Tooling Investments
- Automated Testing & CI/CD: Encourage teams to adopt a pipeline that runs unit, integration, and performance tests automatically. Reduced manual labor, fewer production regressions, and faster feedback loops increase overall engineering throughput.
- Infrastructure as Code (IaC): Standardize dev/staging/production environments through tools like Terraform or Ansible. Minimizes environment drift, a common cause of deployment delays.
2. Streamline Approvals & Governance
- Define “Definition of Done”: Ensure clear standards so that code hitting the main branch is production-ready by default. Align management and stakeholders on acceptable risk levels for self-serve deployments.
- Delegate Decision-Making: Reduce managerial bottlenecks by empowering tech leads to approve merges or sign off on releases. Set guardrails that maintain quality without stifling speed.
3. Optimize Team Collaboration
- Cross-Functional Teams: Organize squads that include dev, QA, Ops, and product managers. Encourage co-location or virtual standups where each role shares daily updates to surface blockers immediately.
- Knowledge Sharing & Documentation: Create an internal knowledge base with best practices, runbooks, and architectural guidelines. Recognize and reward team members who contribute to documentation, this reduces single points of failure.
Impact on Other DORA Metrics
When you lower the lead time, the knock-on effects often show up in your DevOps performance metrics dashboard:
- Deployment Frequency: Faster lead time usually enables daily or on-demand deployments.
- Change Failure Rate: Smaller increments of code are easier to test and validate, reducing overall failure rates.
- Mean Time to Recovery (MTTR): A robust pipeline supports quicker rollbacks and fixes, bringing systems back online faster.
As an engineering leader, track these metrics in a unified dashboard. This makes it easier to communicate progress to C-level executives and stakeholders, translating improvements into business language revenue growth, customer satisfaction, or operational cost savings.
Common Pitfalls & How to Avoid Them
- Treating Tooling as a Silver Bullet: Tools alone won’t fix broken processes or misaligned incentives. Invest time in process improvements and cultural alignment.
- Failure to Communicate ROI: Upgrading CI/CD might require budget approval. Without linking it to faster releases, improved customer outcomes, or reduced production incidents, it’s easy to face pushback.
- Overlooking Team Bandwidth: Introducing new tools and processes demands training. Overload can spike burnout. Allocate dedicated time and resources for learning curves and transition phases.
Conclusion
For engineering leaders, lead time for changes is much more than a technical metric: it’s a strategic driver that affects product velocity, team morale, and bottom-line results. By diagnosing bottleneckswhether in approvals, tooling, or cross-team collaborationand systematically implementing solutions, you’ll empower your teams to move at the speed modern software demands.
By honing your approach to lead time for changes, you’re not only improving DevOps performance metrics; you’re strengthening your entire engineering function, setting the foundation for sustainable growth and exceptional customer experiences.
Additional Resources for Engineering Leaders
- Accelerate (by Forsgren, Humble, Kim)
- State of DevOps Reports