Contents
Share
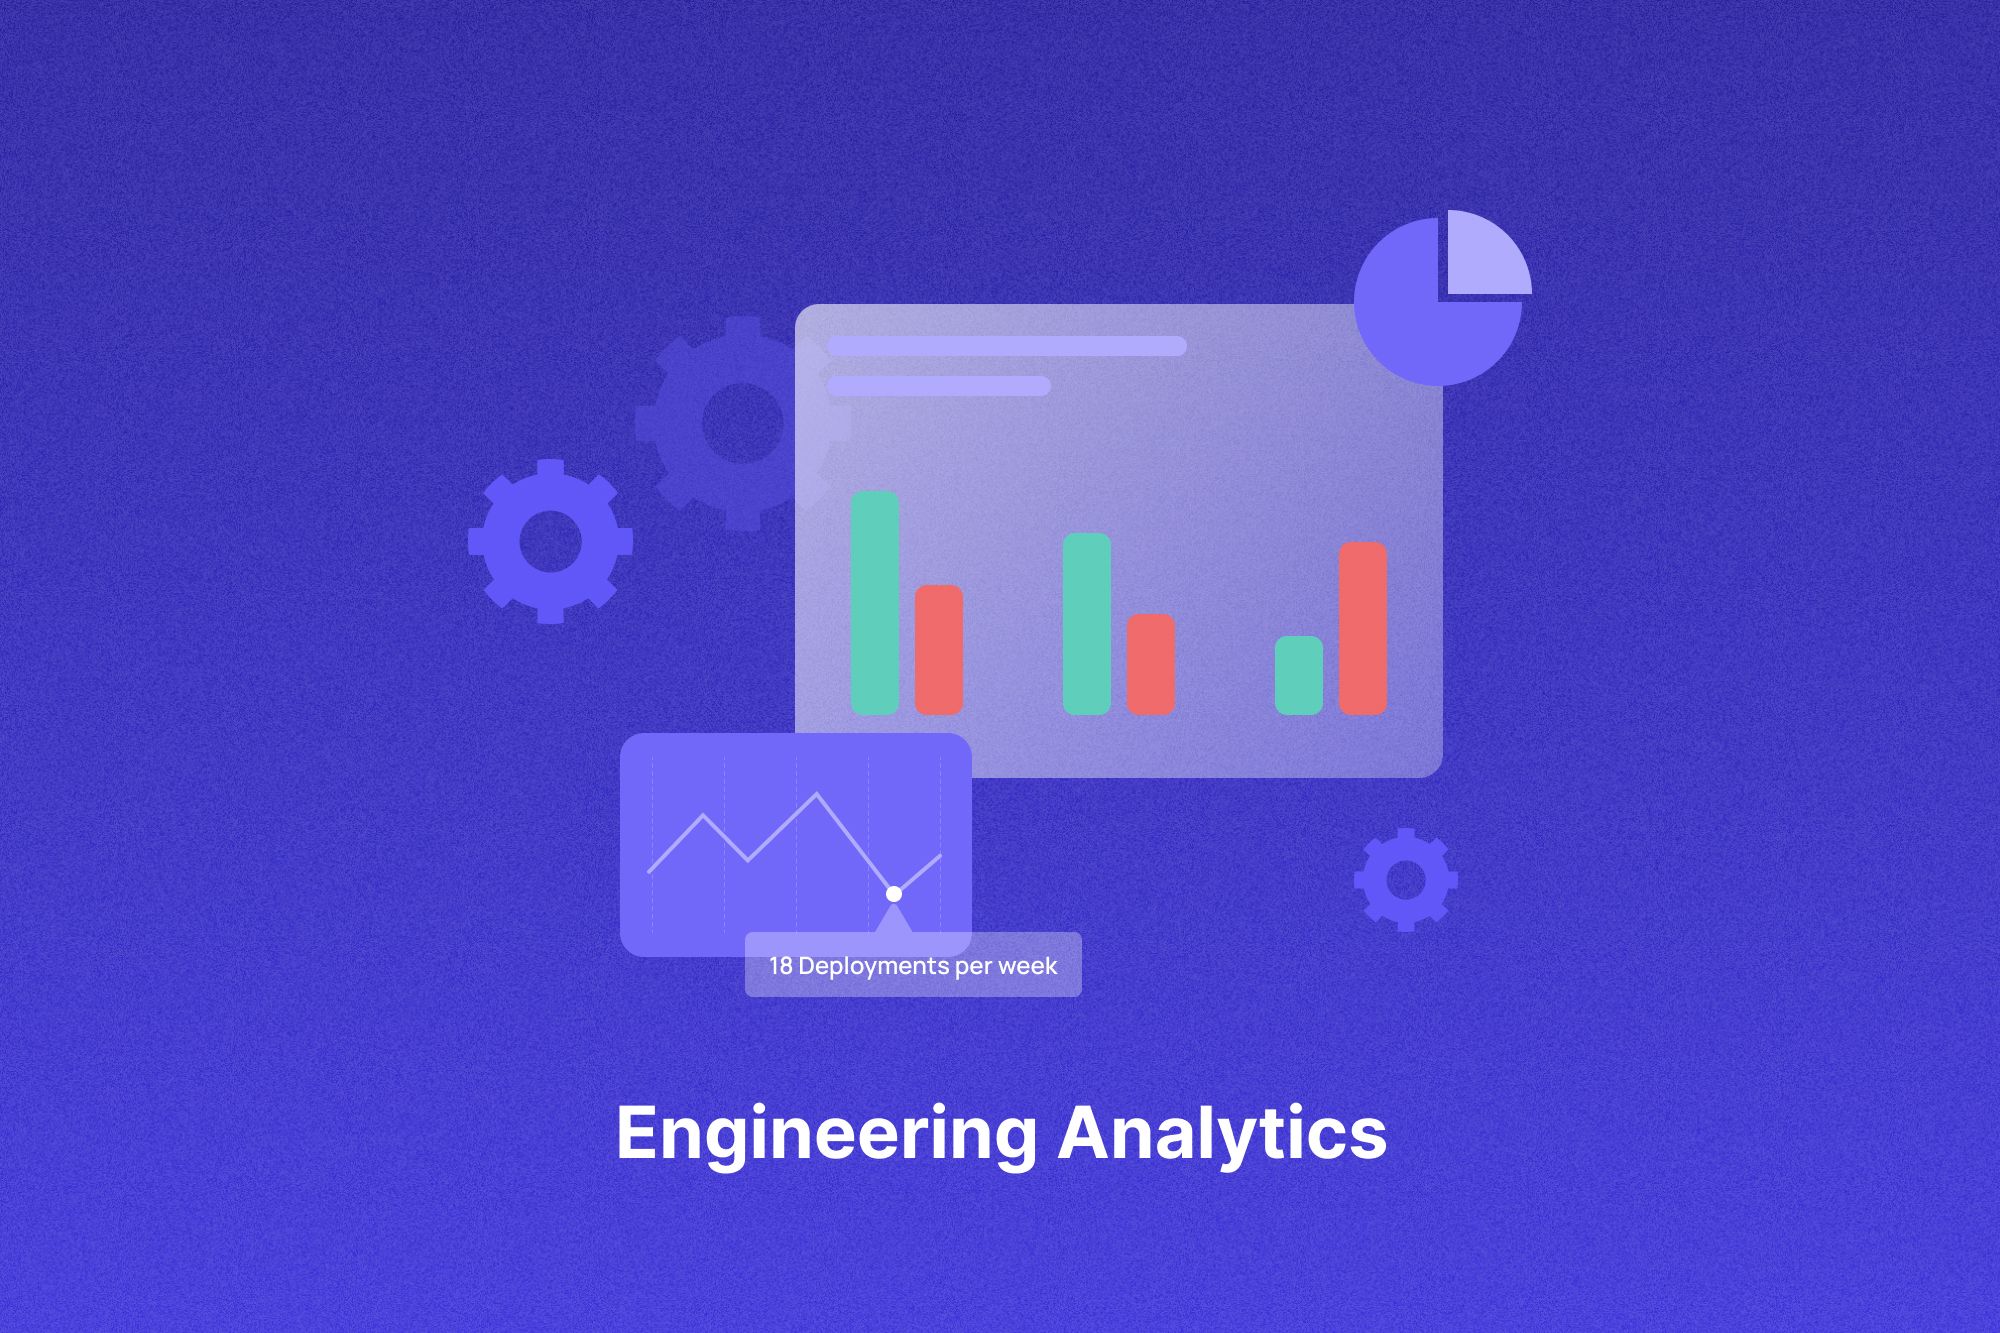
What is engineering analytics? The ultimate guide
Data analytics is the driving force in everything, from sports to healthcare. Similarly, engineering analytics has emerged as a game-changer in the software development landscape. It goes beyond mere data collection; it's about deciphering the hidden insights within the data, which can transform decision-making, save costs, and fuel innovation.
In this article, we explain how software teams can get analytics and valuable insights from their engineering tools. From Git analytics to project management and CI/CD pipelines, we'll explore how engineering analytics empowers software teams to optimize processes, boost productivity, and navigate the complex journey of software development. But first, let’s talk about what exactly is engineering analytics.
What is engineering analytics?
Engineering analytics is the practice of gathering, processing, and analyzing data created by engineering and development tools to acquire a better knowledge of the software development process. It entails employing various data-driven strategies to extract insights and generate meaningful suggestions. Engineering analytics' major purpose is to improve the software development lifecycle, improve product quality, and expedite decision-making.
Power of engineering analytics across software development tools
Engineering analytics is a powerful tool that improves various software development processes. It helps teams work smarter, make better decisions, and easily create high-quality software. In this section, we'll explore real examples of engineering analytics in various tools that software teams use:
Git analytics
Git analytics helps teams gain insights into their development processes and the performance of their codebase. Here's a breakdown of what Git analytics typically involves:
Cycle time
Cycle time, a key parameter in Git analytics, is an important indicator of the efficiency of a software development pipeline. Software teams may track and analyze the time it takes from code commit to deployment using tools like GitHub and GitLab. A lower cycle time indicates that the development and deployment process is nimble and efficient, whereas a longer cycle time may suggest the presence of bottlenecks and inefficiencies that require rapid adjustment.
Using Engineering Analytics to Reduce Cycle Time:
Engineering analytics is a valuable ally for software teams looking to reduce cycle time. These analytics tools help teams discover bottlenecks in their development process, highlighting specific periods where cycle durations tend to increase. With this knowledge, teams may launch focused interventions while simplifying procedures to shorten cycle times.
Furthermore, engineering analytics enables software development teams to make educated, data-driven decisions. Teams may detect patterns and trends in cycle time by analyzing historical data, which gives insights for resource allocation and process improvements. For example, if analytics show that particular types of code reviews routinely take longer than expected, teams might commit more personnel or alter their methods to solve these issues. Analytics also facilitates continuous improvement by allowing teams to set benchmarks and track progress over time, constantly striving to reduce cycle time and increase overall efficiency.
Velocity
The quantity of work performed during a single development iteration is measured by velocity, a crucial parameter in Git analytics. It provides software development teams with a snapshot of their productivity and work progress, allowing them to assess the success of their development efforts.
Using engineering analytics to increase velocity:
By analyzing past performance data and making data-driven decisions, engineering analytics enables software teams to improve their velocity. Teams can find trends and patterns that give insights for improvement by diving into past velocity numbers. For example, if a team routinely sees drops in velocity during various phases of a project, analytics can identify the root causes, leading teams to adopt tactics from more successful phases to boost overall productivity.
Another area where analytics is useful is resource allocation. Teams can more efficiently allocate resources based on past data by employing analytics insights. For example, if analytics show that a lack of resources causes a decline in velocity, teams may address this issue proactively by altering resource distribution. Furthermore, analytics can indicate possibilities for process improvement, such as adopting best practices from higher velocity stages to increase overall productivity.
Project management analytics
Project management analytics aims to provide insights and improve decision-making in project planning, execution, monitoring, and control. Here are some key aspects of project management analytics:
Investment distribution
Investment distribution is a key indicator in project management analytics. Tools like Jira and Linear allow you to assess how resources are allocated across many projects or activities. This statistic is critical for ensuring that a software team's resources are efficiently directed, aligning priority projects with the attention and resources they demand.
Using engineering analytics to distribute investments:
Engineering analytics acts as a guiding light for software teams and project managers, assisting them in making educated resource allocation decisions. Teams can use analytics to determine if their resource allocation corresponds with their organization's strategic objectives. If a mission-critical project is under-resourced, analytics might raise a red signal, triggering essential changes to guarantee it receives the attention it deserves.
Furthermore, engineering analytics is useful in determining the effectiveness of resource allocation. By examining historical data, teams might uncover trends of over-resourcing for particular projects while neglecting others. This historical knowledge enables teams to simplify resource allocation, ensuring that resources are used efficiently. Furthermore, data-driven decision-making is becoming a distinguishing feature of engineering analytics in project management. By integrating investment distribution data with project success measurements, project managers may make evidence-based decisions, ensuring that the correct projects receive the proper resources.
Cumulative flow diagram
Cumulative Flow Diagrams (CFD) are an important part of project management analytics because they provide a visual depiction of work items at various stages of development. These diagrams show the status of work items and stages in the development process in real-time.
Using engineering analytics to create cumulative flow diagrams:
By supporting proactive decision-making and workflow enhancement, engineering analytics enables teams to make the most of Cumulative Flow Diagrams. The insights are priceless:
To begin, Cumulative Flow Diagrams frequently reveal bottlenecks in the workflow when work items are collected. With the help of engineering analytics, teams can quickly identify bottlenecks, setting the path for targeted interventions that accelerate work processes.
Second, analytics tools give a retrospective view of the development process. Project managers acquire a thorough picture of workflow efficiency and effectiveness by analyzing how work items progress through different phases over time. This tracking allows them to make data-driven decisions and modifications.
Finally, when combined with other performance data, the insights generated by Cumulative Flow Diagrams aid teams in improving their operations. For example, if the picture shows chronic backlogs in the testing phase, engineering analytics can lead teams to modify their testing methods, increasing overall efficiency.
CI/CD analytics
CI/CD analytics provides insights into the efficiency, quality, and performance of CI/CD pipelines and helps teams make data-driven decisions to improve their software delivery processes. Here are some key insights you can derive from CI/CD analytics:
Deployment frequency
In CI/CD analytics, deployment frequency is of the utmost significance. This metric is managed by tools like Jenkins and CircleCI, which provide software teams with insight into the frequency with which new code changes are delivered to production. A high deployment frequency indicates an agile and responsive development approach.
Using engineering analytics to increase deployment frequency:
Engineering analytics serves as a compass that directs software development teams toward maximizing deployment frequency. Teams may make decisions that encourage continuous improvement by using data-driven insights:
To begin, teams may examine their responsiveness to the ever-changing software development needs by analyzing historical data on deployment frequency. Analytics give a comprehensive perspective of their CI/CD processes and show opportunities for improvement.
Second, resource allocation is critical in determining deployment frequency. The influence of resource allocation on deployment efficiency is demonstrated using engineering analytics. If analytics identify resource constraints as a barrier to quick deployments, teams may make modifications to manage resources more efficiently, guaranteeing a more frequent and agile deployment cycle.
Finally, integrating deployment frequency data with other performance measures like code quality and reliability enables teams to make data-driven decisions to improve the deployment process. These insights lead to more consistent and efficient releases promoting a responsive and agile development process.
Mean time to recovery
Mean Time to Recovery (MTTR) is the lifeblood of CI/CD analytics, measuring the average time it takes to recover from production failures. A shorter MTTR indicates a more comprehensive issue response procedure, which results in fewer interruptions and downtime.
Using engineering analytics to improve MTTR:
Engineering analytics is critical in improving MTTR by providing software teams with tools to decrease recovery times:
To begin, analytics tools assist teams in quickly identifying the core causes of errors and bottlenecks in their problem-resolution procedures. This focused knowledge enables teams to implement process improvements, resulting in a reduction in MTTR.
Second, historical MTTR data analysis gives teams a better knowledge of their problem response efficiency over time. This historical view aids in effectively managing failures by supporting data-driven decisions for process enhancement.
Finally, engineering analytics shows how resource allocation affects MTTR. If analytics show that specific failures routinely result in higher recovery times, teams may more efficiently devote resources to solve these recurrent issues, decreasing MTTR and minimizing production interruptions.
Incident management analytics
Incident management analytics provides insights into how incidents are detected, resolved, and prevented, helping organizations improve their incident response processes and minimize service disruptions. Here are some important elements of incident management analytics:
Incident frequency
Incident frequency, a fundamental statistic in incident management analytics, is made possible by tools such as PagerDuty and Opsgenie. It entails monitoring and analyzing events or occurrences within a software system. This statistic provides useful insights into trends, core causes, and the ability to take preventive actions to solve reoccurring problems for software teams.
Leveraging engineering analytics to reduce incident frequency:
Engineering analytics can assist software teams in reducing issue frequency. It enables teams to make data-driven choices and solve problems more effectively:
To begin, teams can uncover patterns and trends by analyzing past event data. They learn which occurrences are most common, what causes them, and how frequently they occur. This data is useful for identifying possible problems, putting preventative measures in place, and fine-tuning procedures to minimize incident frequency.
In addition, teams can react more quickly to new issues when they have the capacity to track the frequency of incidents in real-time. Teams can spot abnormalities and patterns that may be early predictors of greater difficulties by combining real-time data with past trends. This preventive strategy reduces the severity of crises and prevents them from escalating.
Alert fatigue
In incident management analytics, alert fatigue is a crucial statistic. It is calculated by calculating the number of notifications received by team members. This measure is critical for determining the effectiveness of alerting systems. Managing alert fatigue ensures that team members remain aware of crucial signals while not being overwhelmed by non-essential notifications.
Using engineering analytics to reduce alert fatigue:
Engineering analytics is critical in reducing alert fatigue. Here's how it helps teams manage and minimize this problem:
First, analytics tools enable teams to examine how alert fatigue affects incident response. They can uncover patterns and trends by analyzing data on alert volume and team responsiveness. Teams may then take specific actions such as lowering alerting thresholds, minimizing noise in the alerting system, or fine-tuning notification tactics.
Teams may better prioritize their efforts by integrating alert fatigue data with incident frequency and impact data. Engineers can use engineering analytics to identify the most urgent alarms requiring rapid response. This prevents team members from being overwhelmed by a rush of non-essential alerts, allowing them to concentrate on dealing with high-priority problems.
Code analytics
Software development teams use code analytics tools and processes to ensure their codebase is well-structured, efficient, secure, and compliant with coding standards. Here’s what it entails:
Code smells
Code smells, which are a primary focus of code analytics tools such as SonarQube, are signs of potentially problematic areas of the source. Inefficient or duplicated code and inadequate organization, naming, or commenting are examples of these difficulties. Detecting code smells is critical for ensuring code quality and long-term viability.
Using engineering analytics to manage code smells:
Engineering analytics enables software teams to manage and eradicate code smells, assuring code quality and maintainability. Here's how analytics can help with this effort:
Code analytics tools give a thorough overview of code smells throughout the codebase. By analyzing this data, software teams can discover particular areas that require attention and reorganization. The statistics also provide insight into the severity of each issue, allowing teams to prioritize their efforts efficiently.
Engineering analytics assists teams in tracking the progress of code smell resolution over time. This data-driven strategy allows teams to quantify the effect of their efforts, ensuring that code quality improves over time. Software teams may keep their codebase clean and efficient by tracking and resolving code smell trends.
Security vulnerabilities
Security vulnerabilities are an important target of code analytics tools. These technologies, notably SonarQube, are critical for finding codebase flaws that attackers might exploit. Recognizing and correcting these flaws is critical to guaranteeing the software's resilience against possible threats and assaults.
Using engineering analytics to address security vulnerabilities:
Engineering analytics is critical in controlling and mitigating security risks in codebases. Here's how analytics may help software teams in this regard:
Code analytics tools provide detailed insights into the security flaws in the codebase. By analyzing this data, teams can detect individual flaws and their potential influence on software security. This understanding helps teams prioritize vulnerabilities that require quick addressing.
Engineering analytics enables teams to monitor the status of vulnerability resolution. Teams may guarantee that detected vulnerabilities are handled promptly by monitoring the status of identified vulnerabilities. This method assures that the software is safe and resistant to potential dangers.
Navigating the future with engineering analytics
Effectively leveraging engineering analytics from various tools is critical for software teams seeking continuous improvement. These metrics can help teams improve their software development procedures and produce high-caliber software. Using engineering analytics solutions like DevDynamics to analyze engineering activities across several software development tools is critical. We integrate with tools like JIRA, GitHub, BitBucket, and GitLab to provide comprehensive insights into deployment, velocity, engineering time allocation, review process, and more.
Ready to drive engineering success?
