Contents
Share
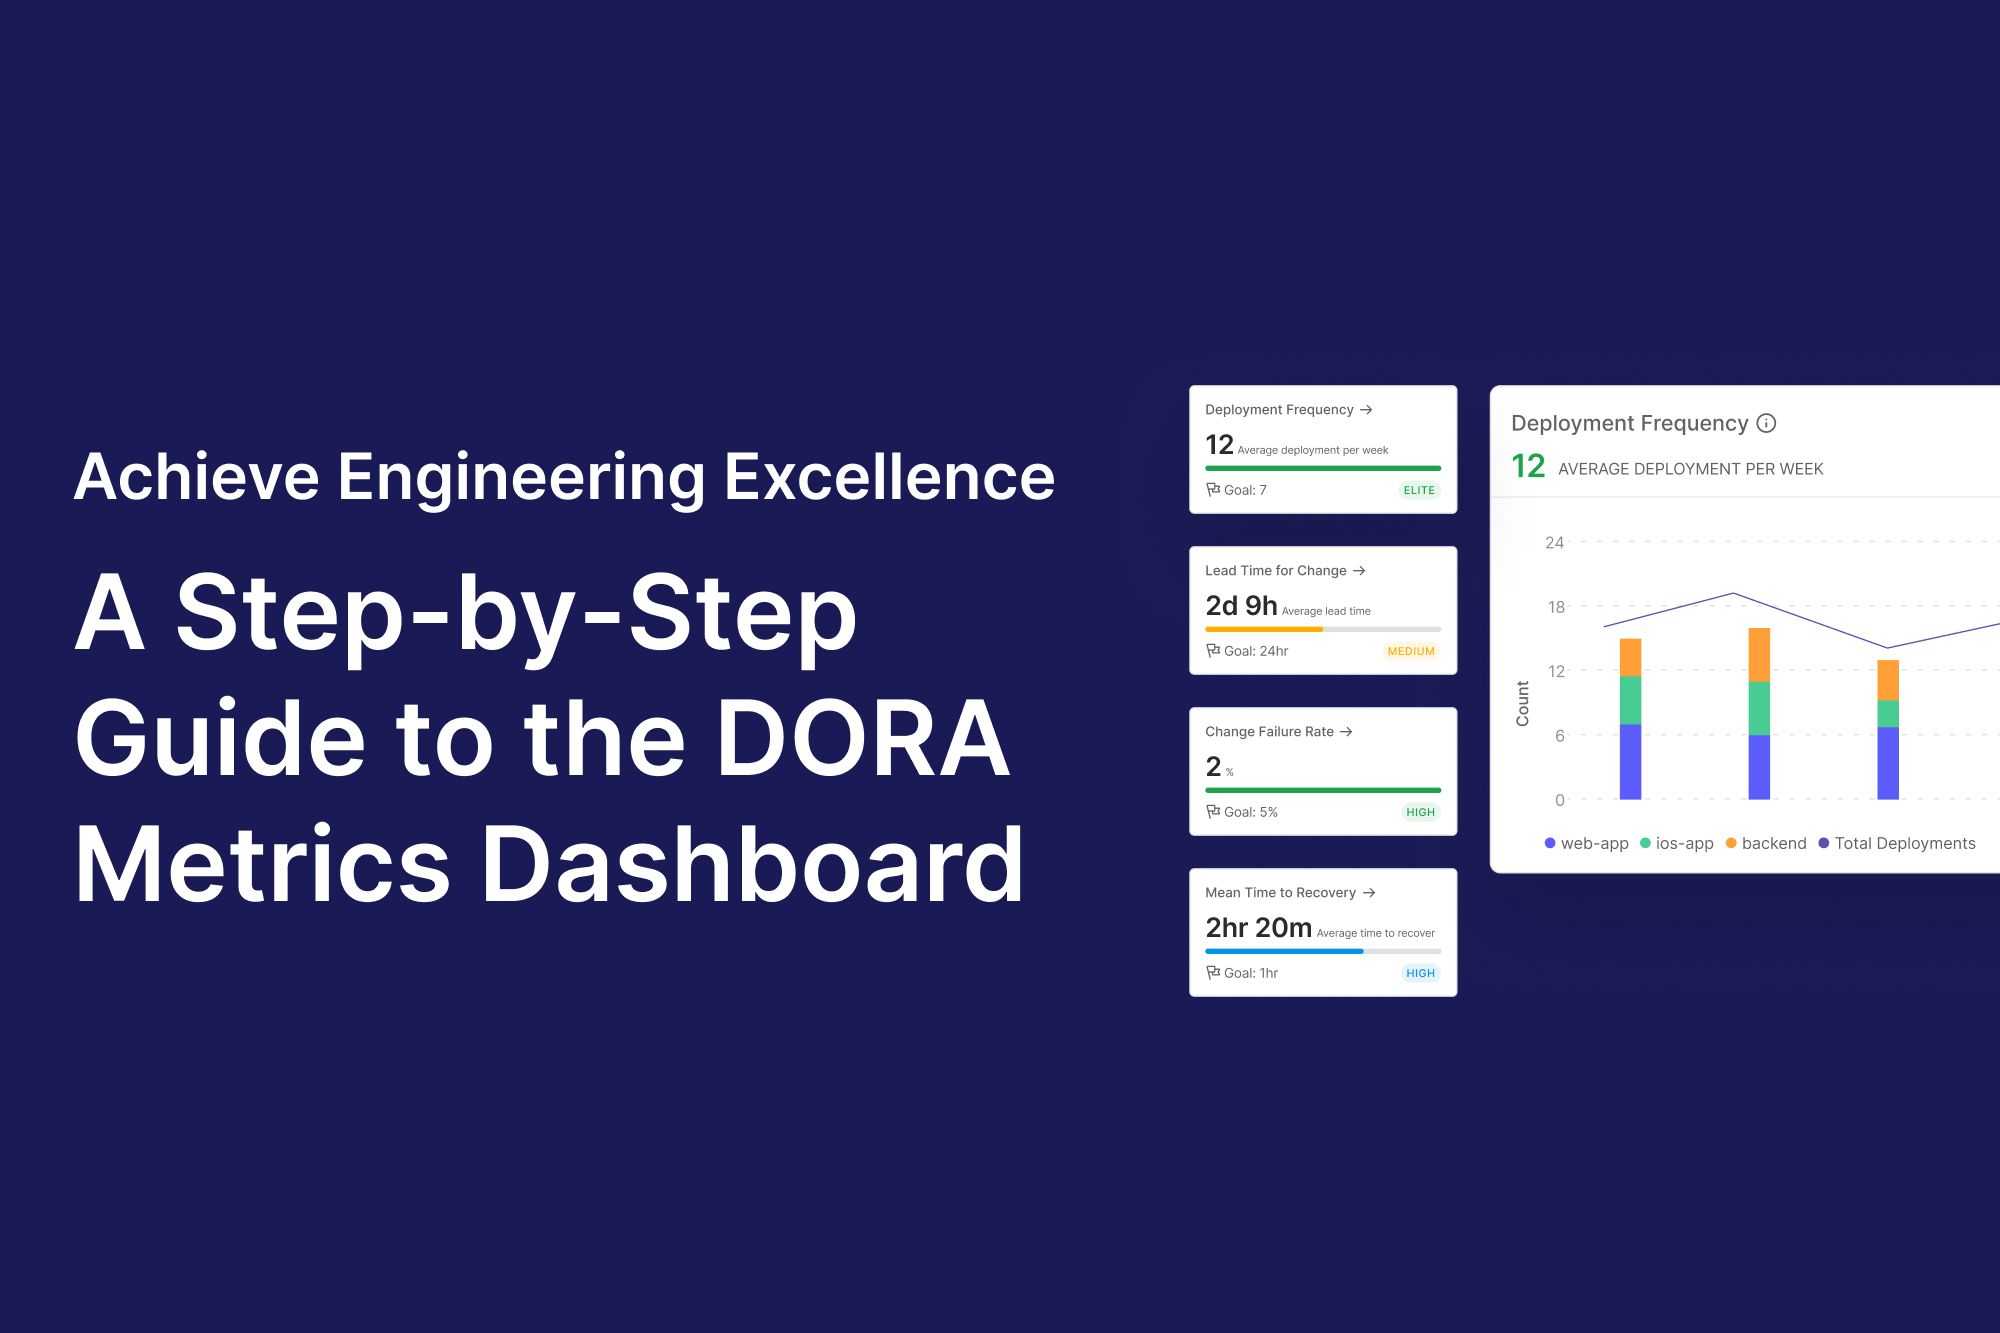
Achieve engineering excellence: A step-by-step guide to the DORA metrics dashboard
DORA metrics, developed by Google's DevOps Research and Assessment team, provide key insights into your engineering team's performance. Measuring performance with these metrics, such as deployment frequency and lead time for changes, is crucial for understanding and improving your development processes. However, accurately tracking these metrics can be a daunting task, especially if you're trying to do it manually. Without the proper tools, this process can become labor-intensive and overwhelming.
In this article, we'll dive into the challenges you might face while setting up a DORA metrics dashboard. We'll explore how to get a DORA metrics dashboard that perfectly fits your organization and helps you measure and boost the quality of your software development process. From integration issues to aligning the dashboard with your specific goals
What are DORA metrics?
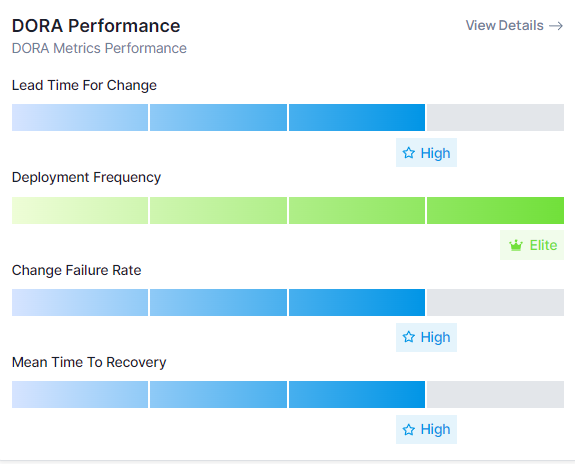
DORA metrics are divided into four key categories: Deployment Frequency, Lead Time for Changes, Mean Time to Recovery, and Change Failure Rate.

Image Source - https://lh3.googleusercontent.com/
- Deployment frequency: Deployment Frequency measures how often your team releases new code into production. High-performing teams aim for frequent, smaller deployments to ensure faster feedback and continuous improvement.
- Lead time for changes: It captures the time it takes from code commit to deployment. The shorter the lead time, the quicker your team can respond to changes and deliver new features.
- Mean time to recovery (MTTR): MTTR measures how quickly your team can restore service after an incident. A low MTTR indicates robust incident response processes and resilient systems.
- Change failure rate (CFR): It tracks the percentage of deployments causing failures in production. High-performing teams maintain a low CFR by emphasizing automated testing, thorough code reviews, and incremental releases.
Common issues in crafting a DORA dashboard
Manual effort
Building a dashboard manually can be labor-intensive and inefficient. Organizations often struggle with the time and resources required to set up and maintain a DORA metrics dashboard without the aid of automated tools that can process data collection and visualization.
Connecting the dots
Probably the major challenge is aggregating data from multiple sources. To receive relevant DORA metrics like lead time for changes or deployment frequency, you will need to draw data from several tools: Gitlab for deployment dates and Git for code commits. More often than not, it means manually exporting data from one tool and importing it into another. This is slow, as different tools use different data formats, hence it is error-prone.
Clear data visualization
DORA metrics can generate complex datasets, so it’s crucial to design a dashboard that presents this information clearly and understandably. The dashboard should be user-friendly and cater to various stakeholders, like developers and executives, with customization options to meet their different needs. However, creating such a dashboard from scratch can be time-consuming and resource-intensive.
Challenges faced by engineering leaders
The data overload
Engineering managers and CTOs often grapple with overwhelming data from various tools and platforms. This data overload can obscure the insights needed to make informed decisions.
Balancing speed and stability
The constant push to release features quickly can compromise stability. Engineering leaders need a way to balance these demands without sacrificing quality.
Aligning teams and stakeholders
Translating technical metrics into business value is crucial. Engineering leaders must communicate the significance of these metrics to non-technical stakeholders to secure buy-in and drive organizational change.
How DevDynamics DORA dashboard addresses these challenges
Simplified integration and comprehensive visibility
DevDynamics DORA Dashboard provides API connectivity and an on-premises agent, ensuring easy integration with your existing tools. This unified view consolidates data from Git repositories, CI/CD pipelines, and issue trackers, giving you a comprehensive snapshot of your team's performance.

Deployment Frequency
Better business alignment
DORA metrics on the dashboard translate technical performance into business value, making it easier for engineering leaders to communicate with non-technical stakeholders. This alignment ensures that engineering goals support broader business objectives and helps secure buy-in from all sides.
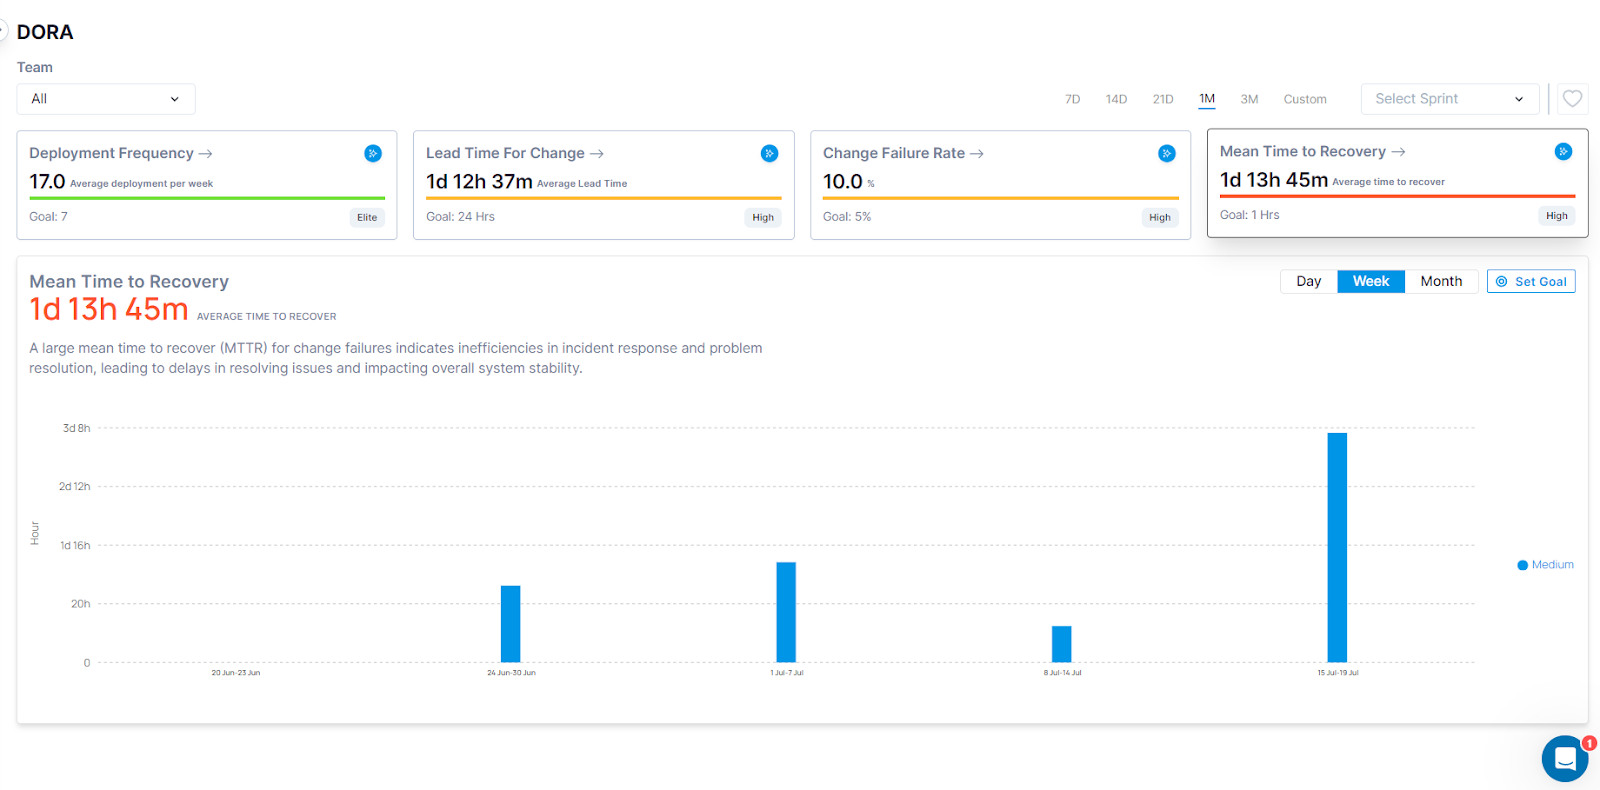
Mean Time To Recovery
Insights and benchmarking
Devdynamics DORA metrics dashboard offers insights and industry benchmarks, helping you understand how your team stacks up against others. This context is crucial for setting realistic goals and identifying areas for improvement.
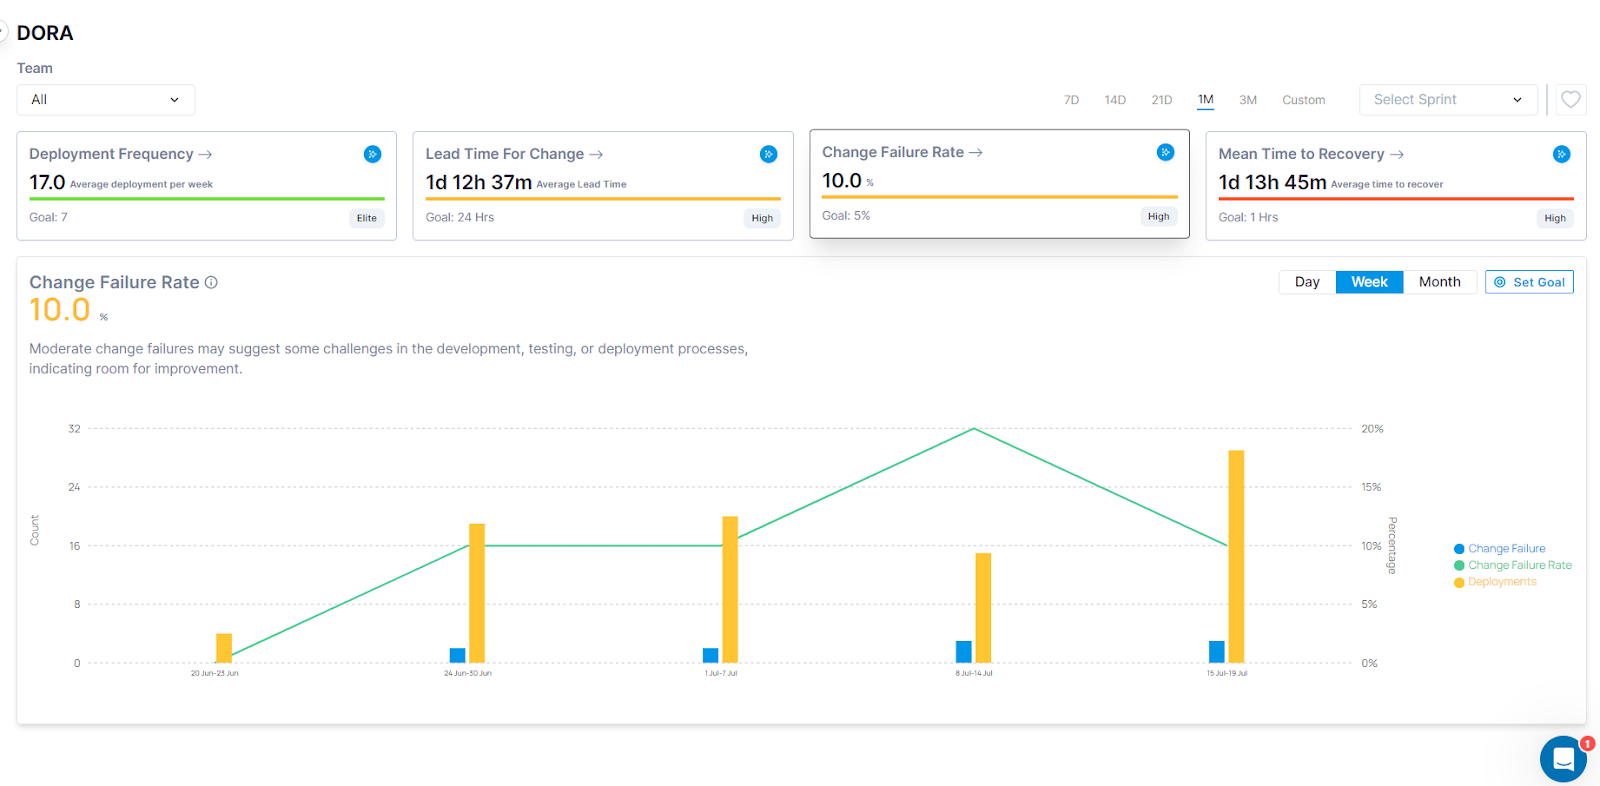
Change Failure Rate
Analytics
The DevDynamics DORA Dashboard focuses on actionable insights. It highlights bottlenecks and inefficiencies, enabling you to prioritize improvements effectively. For instance, if your lead time for changes is lagging, the dashboard will help you identify whether the issue lies in coding, code review, or deployment.

Lead Time for Change
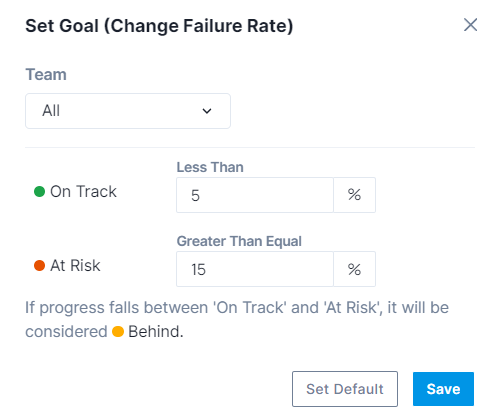
Set goals and team categories
DevDynamics goes beyond basic metrics by allowing you to set specific goals for each DORA metric. This feature ensures you can focus on your unique needs and track progress against these goals, providing a clearer path to achieving performance targets.
Devdynamics DORA metrics dashboard also supports tracking metrics by team categories. This functionality allows you to analyze performance across different teams, making it easier to identify high-performing areas and those needing improvement. By segmenting performance data, you can gain more insights and address specific challenges without the headache of manual analysis.
Conclusion
DORA metrics dashboard provides a clear, data-driven path. They help engineering leaders balance speed and stability, handle data overload, and align technical efforts with business goals.
DevDynamics DORA metrics dashboard simplifies the process of tracking these metrics, offering insights and analytics that drive continuous improvement. Whether you're a start-up founder, CTO, or engineering manager, leveraging DORA Dashboard is a strategic move toward building a high-performing, resilient engineering team.
Click here to learn more about how DevDynamics can help you track and improve with the DORA metrics dashboard.
By consistently tracking and optimizing DORA metrics, you empower your team to make data-driven decisions, improve processes, and ultimately deliver greater value to your customers.
