Contents
Share
What are DORA metrics and why do you need them?
Improving engineering processes is a key component in ensuring faster and more efficient product delivery. Using engineering metrics is critical for achieving this - these metrics can be used to identify areas for improvement, track progress, and make informed decisions about processes, tools, and people.
So, how can a software team begin exploring the world of engineering metrics?
Here’s where DORA metrics leap to the rescue by helping you measure and optimize your engineering team’s performance.
What are DORA metrics?
DevOps Research and Assessment (DORA) metrics are used by software engineering teams to measure their performance and make data-based decisions for improvement. These metrics help teams determine whether they fall into the category of 'elite performers' or 'low performers'.".
Just like Rome, DORA metrics weren’t built in a day. It’s the culmination of a seven-year research program. Acquired by Google in 2018, the study analyzed software engineering operations and functionalities collected from more than 32,000 data points.
Between 2014 and 2019, the group published annual benchmark reports “State of DevOps,” highlighting best practices and listing ways the engineering team can make processes more efficient. Based on their research, the group identified four essential metrics in their book Accelerate that help measure developers’ performance. According to them, high-performing teams are the ones who optimize for the four metrics.
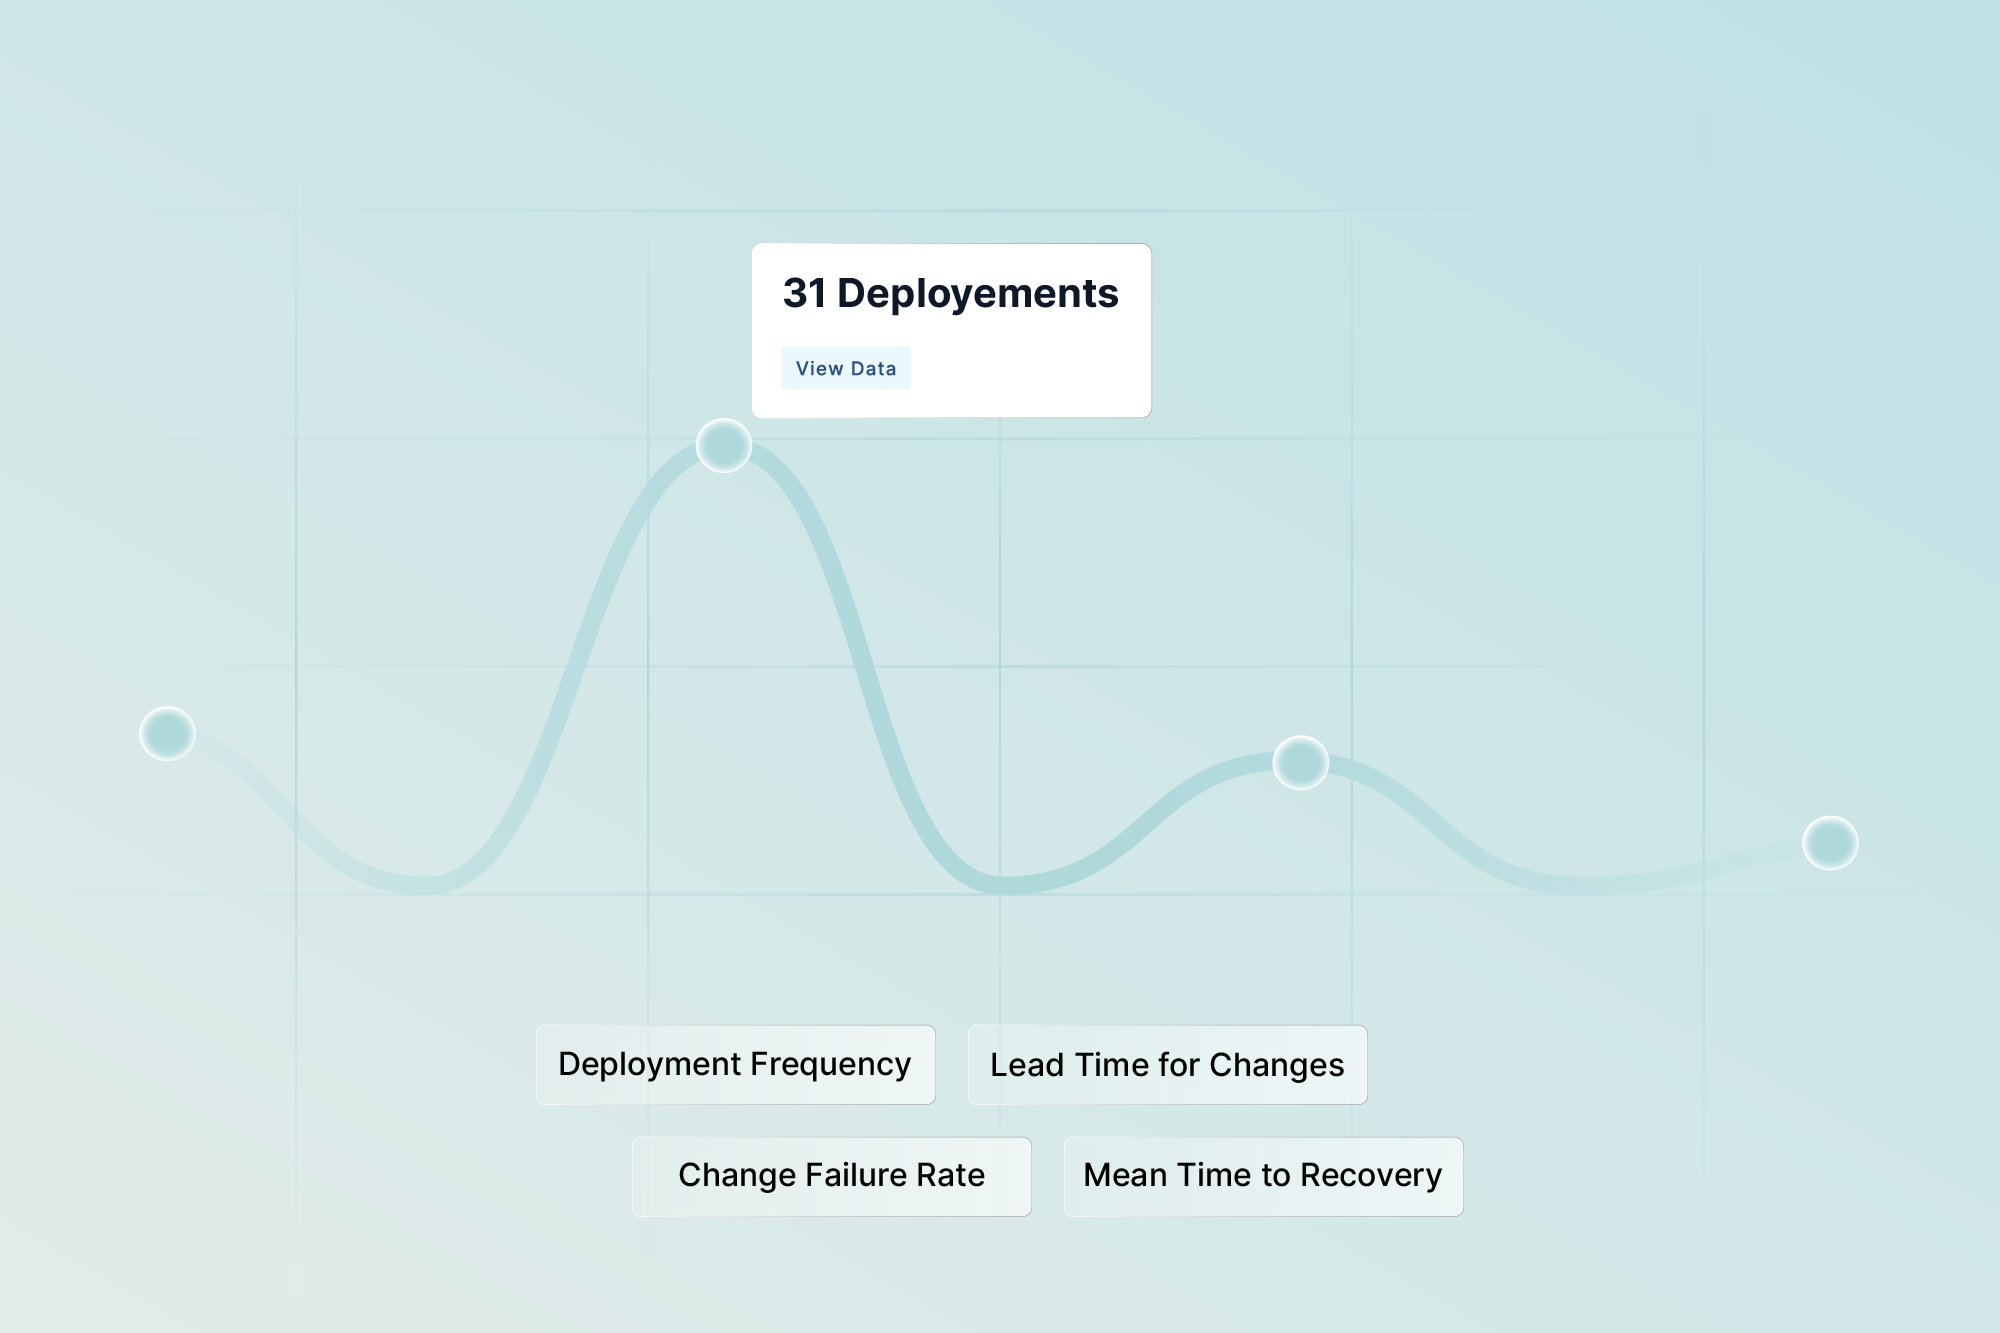
The metrics in question are:
- Deployment Frequency
- Lead Time for Changes
- Mean Time to Recovery
- Change Failure Rate
With these metrics, companies can improve visibility, remove inefficient processes, and deliver timely solutions.
Now that we understand the why and the how let's explore each metric and its importance.
The four key DORA metrics.
Deployment frequency
Deployment Frequency refers to the number of times a company successfully deploys software releases. Essentially, this metric measures the consistency of your delivery using the total number of deployments each day as a reference.
Based on DORA’s research, “elite teams” tend to deliver smaller and more frequent deployments. Generally, one deployment a week is considered standard. However, high-performing teams may release nearly seven deployments in a single day. “Low performers”, according to DORA, are teams that push changes less than once every six months.
Measure this metric using the following formula:
Deployment Frequency = Total number of deployments / Total time
For instance, if you’ve made 20 deployments in 4 months, your deployment frequency will be 5 deployments per month. Engineering leaders can keep in mind organizational-specific goals while calculating deployment frequency. Some teams might find it best to measure this metric daily, while others might prefer weekly or monthly calculations.
To calculate deployment frequency, engineering organizations need tools to track the number of deployments and the time between them. This could be a tool designed for monitoring deployment frequency, or you can extract deployment data from sources like CI/CD tools or JIRA (if your team tracks deployments as tickets).
Lead time for changes
Lead Time for Changes measures the time for a committed code to be shipped to production. It is used to gain a more comprehensive understanding of your team’s cycle time and how they handle increases in requests.
According to DORA’s research, “elite performers” ideally take less than an hour to release code to production, whereas “low performers” may take one to six months to do the same.
The lower the lead time for changes, the higher the efficiency of the engineering team in deploying code. Longer lead times are indicative of roadblocks in the approval and deployment process.
To calculate this metric you need to have two relevant data sets - precise time of commit and precise time of deployment. What this implies is that you need to maintain a record of all the deployments as well as a list of changes made in the deployment. The data can be collected through spreadsheets or project management tools.
Mean time to recover
Bouncing back from failures isn’t just a superhero thing, developers also need to do quick damage control for unforeseen incidents. That’s precisely what the Mean Time to Recover (MTTR) measures. It calculates the time spent between a failure and recovery.
Even the most efficient software engineering team in the world will face unplanned incidents. And since it’s practically impossible to avoid them, the time it takes for your developers to restore services and recover the application becomes a critical component.
Based on the benchmarks identified by Google, “elite performers” have a recovery time of less than an hour, while the MTTR of “low performers” may run into days or even months. Companies can track MTTR over time to see how their team has improved their incident response framework.
To calculate MTTR, you need to access the total amount of downtime experienced by a system and divide it by the number of failures over a specific period. For example, if a system experienced 3 outages, with the first one lasting 2 hours, the second one lasting 3 hours, and the third one continuing for 4 hours. Then, the total amount of downtime would be 2+3+4 = 9 hours, and the MTTR for the system would be 9/3 i.e. 3 hours.
Engineering leaders can access this data by either manually tracking every failure event (in spreadsheets), or they can leverage maintenance management and reliability analysis software to automatically monitor downtime.
Change Failure Rate
Change Failure Rate calculates the percentage of changes made to a code that ended up resulting in rollbacks, failures, or incidents. By monitoring this metric over time, managers can derive deep insights into the time spent by their team on delivering new code and fixing bugs.
The lower the change failure rate, the better. While a high percentage indicates the presence of several bottlenecks in your team’s process, on the other hand, a low change failure rate reflects that your software team can quickly adapt to feedback and changes. Based on the research, “elite performers” fall somewhere between 0-15%, while “low performers” lie in the range of 46-60%.
This metric takes into account two factors - the number of deployments attempted and deployments that resulted in failures in production. It can be calculated through the following formula:
Change Failure Rate = Number of deployment failures/ Total number of deployments * 100
For instance, if engineers made 50 changes to the system and 5 out of those failed, then the change failure rate will be (5/50)*100, i.e. 10%.
Just like MTTR, engineering teams can use maintenance software and spreadsheets (Microsoft Excel or Google Sheets) to calculate change failure rates. Some organizations can also build custom tools to calculate change failure rates for their systems.
Using DORA metrics for engineering excellence
Engineering managers and leaders are in the unique position of steering their teams in the right direction and providing them with tools that are essential to success. Tracking DORA metrics over time helps them peer into the software development process and identify areas for improvement.
Previously, organizations came up with individual metrics to quantify the performance of development teams. While they were beneficial, it was difficult to benchmark their performance or compare them with different teams and organizations. DORA metrics provide organizations with a uniform, transparent framework to measure software delivery. Software development teams can also use them to see where they stand and what steps they need to take to meet customer needs.
There’s a lot more you can do with them. Presently, DORA metrics are the quarterbacks of the software development landscape. With the four metrics at their disposal, teams can also:
- Identify and remove obstacles in the delivery process
- Optimize value stream operations
- Boost software development velocity
- Ensure higher quality output
- Make data-driven decisions
- Deliver higher value to customers
DORA Metrics: The way ahead
DORA metrics have emerged as the true North Star for engineering organizations. But even someone as strong as Superman has a weakness and you might need Batman for backup. So, while DORA metrics may be the Holy Grail for developers, other metrics can come to your rescue.
DORA metrics are undoubtedly a great starting point for engineering teams. And eventually, you can graduate to other metrics like the SPACE framework. That does not mean you can only use one of them at a time. In fact, DORA metrics and SPACE metrics can be used together to provide a more holistic picture of your team's performance.
However, keep in mind that DORA metrics will not work well if you use them for individual performance. These metrics are more team-focused and highlight the efficiency of your team rather than an individual. So, if you slice and dice these metrics right down to a single developer, you’ll lose sight of the larger context. Additionally, for maximum output, it’s ideal to tweak the metrics based on your team’s goals.
Ultimately, engineering leaders don’t need to limit themselves to a single set of metrics to evaluate their team’s performance. That approach is myopic at best and catastrophic at worst. Instead of relying on a singular framework, DevDynamics offers a whole suite of analytical tools to optimize engineering output. Think of DevDynamics like the JARVIS to your Iron Man (or Alfred to your Batman if you’re a DC fan!)
See how DevDynamics can help you track DORA Metrics.
Conclusion
DORA metrics are a sure-shot way for leaders to undertake data-driven decisions regarding their team’s performance. Tracking them over time allows engineering leaders, managers, and developers to tweak their efforts in a bid to improve efficiency. As an established set of benchmarks, DORA has become foundational for engineering operations.
With improved DORA metrics, your team gets the added confidence that the ship’s steering in the right direction and you’re delivering high value to customers.
Wondering if DORA is relevant for you startup?