Contents
Share
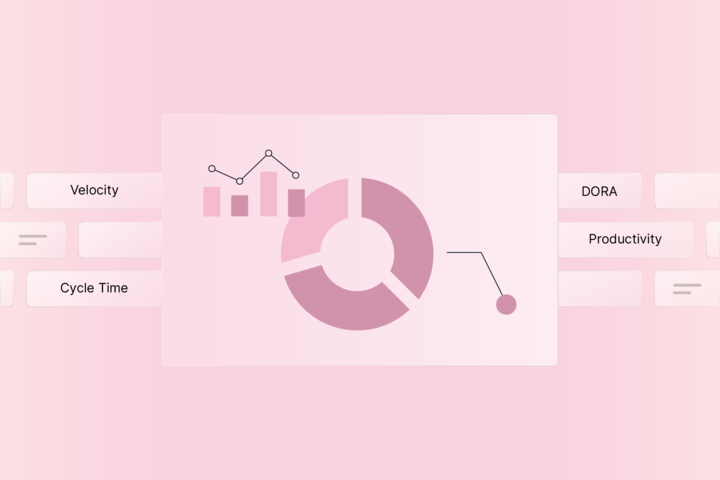
Engineering Metrics That Matter in 2023
As more businesses become software-driven, business objectives are now increasingly driven by the decisions taken by your engineering team. This is where engineering metrics help you make data-driven decisions.
But there’s so much going on with engineering teams and their operations, with the increasing number of tools that dev teams use. So, how do you decide which metrics you should look at? And which ones are critical to ensure your team's (and organization’s) overall success?
This guide covers the most critical and robust engineering metrics that matter in 2023. And which you, as an engineering leader, should keep on your radar.
What are engineering metrics?
Let’s start with the basics: engineering metrics help you measure each stage of the software development process. Engineering leaders can use them to track performance right from planning to deployment.
For example, you can use a metric like cycle time to see how long it takes to complete a task like fixing a bug or adding a new code. Or, you can pick up investment profile metrics to measure the time your team spends on different kinds of work.
But how will you go about accessing these metrics? Since engineering teams work across several tools like Git, Jira, PagerDuty, CI/CD, etc., you can pull data from these tools to calculate relevant metrics.
In recent years, multiple studies and books have resulted in high-quality metrics like DORA and The SPACE Framework, which in turn have taken our understanding of velocity and developer productivity to the next level.
Benefits of engineering metrics
Well, first off, with metrics, you can quantify and understand your engineering team’s baseline activities to see if they’re thriving or if there are areas that need improvement. Metrics also allow you to compare performance with different teams within your org and with other companies. By doing so, you can pinpoint high-performing teams and see what they’re doing right so that you can implement the same for other teams.
Using metrics also enables you to make data-driven decisions to boost productivity, velocity, and team health.
Engineering managers can leverage them to optimize engineering operations like
- Reduce time taken to build new features
- Increase throughput
- Reduce time taken to resolve tasks
- Mitigate risks by identifying roadblocks ahead of time
- Improve team efficiency and collaboration
Now that we know what benefits you can derive from these metrics let’s delve into which ones you should pick out of the lot.
Top engineering metrics to consider
There are hundreds of metrics you can track, but which ones are specifically relevant to your team depends on your team’s objectives. We’ve selected a few engineering metrics that matter in 2023. They are invaluable no matter the size of your engineering org.
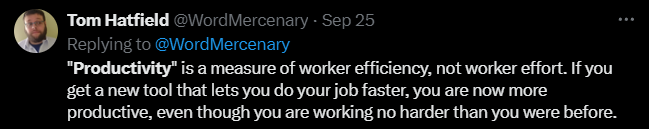
Productivity metrics
Tasks completed
Tasks completed or tasks closed are the simplest activity metrics. It tells you the total number of tasks every employee or every team has completed within a specific period.
As a manager, you should definitely keep an eye on this because it shows you how productive every department has been. While it’s useful for every department so if you’re wondering why we’ve included this in engineering metrics specifically is because developers have a lot of long-term and short-term tasks to tend to on a daily basis.
Using this metric, engineering leaders can gauge if their developers are finishing tasks on time or if they’re lagging behind. With an overview of the team-wise distribution of tasks assigned, completed, and ongoing at their disposal, managers can make decisions to pass on some tasks to less stressed teams to ensure the smooth running of all dev teams.
Focus Time
Interruption is a developer’s kryptonite, and they’re deadly to their productivity. In fact, 46% of developers spend less than 20 hours uninterrupted on dev tasks per week.
From hopping from one meeting to another and constantly hearing the “ding” from Slack messages, there are many ways for a developer to be distracted. That’s why focus time has emerged as one of the go-to metrics to understand productivity.
Focus time is the time dedicated to tasks without being interrupted. The goal of this metric is to eliminate external distractions and noise so developers can focus on getting deep work done.
Quality metrics
These metrics focus on the quality of engineering processes, solutions, and projects. Below are some examples of quality metrics you can use:
Change failure rate
Another one of the DORA metrics, Change Failure Rate, calculates the number of times a deployment by engineering teams has resulted in failure or negative user experiences. These usually constitute changes that either lead to a bug or have to be rolled back because they didn’t meet customer expectations.
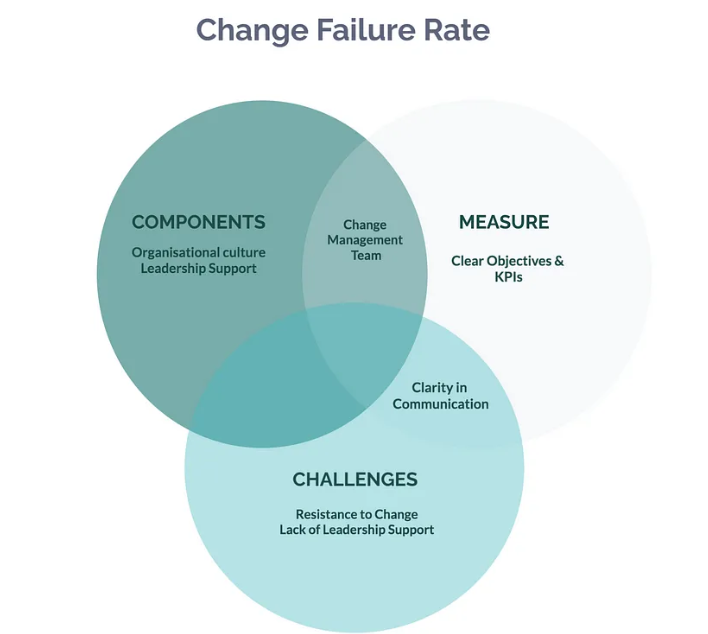
Using this metric, engineering organizations can get insightful information regarding the quality of software built by teams. Moreover, it’s a crucial metric to include in your list because a high change failure rate signifies that your team might be pushing lower-quality software, which will eventually lead to dissatisfied customers and loss of revenue.
Customer satisfaction
Customer satisfaction is paramount to the success of any business and is also a sign that you’re delivering high-quality products or services.
You can use CSAT metrics, usually deployed via surveys and polls, to gauge your customers’ satisfaction with your product’s quality. This data is usually asked as a question - “how satisfied are you with our product?” and collected on a five-point scale where customers can select one of the following:
- Highly satisfied
- Satisfied
- Neutral
- Dissatisfied
- Highly Dissatisfied
Mean Time to Recovery (MTTR)
A part of the four DORA Metrics, Mean Time To Recovery (or restore) measures how quickly an engineering team can bounce back from failure. “Failure,” in this case, can be anything that negatively impacts production, like a bug or an outage.
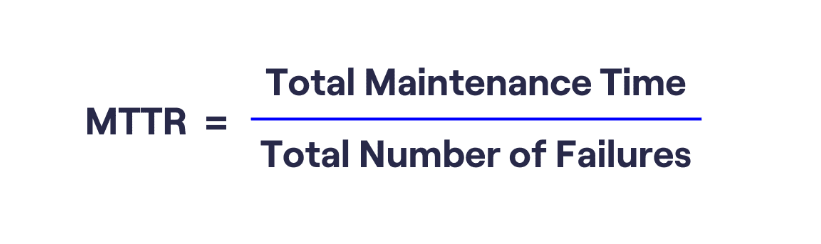
It’s a quality metric in the sense that it measures the amount of time it takes for your team as a unit to understand the problem at hand and resolve it. So if your team has a low mean time, it means that if a problem arises, it is quick to restore functionality.
Velocity metrics
These metrics measure the average amount of work a team can complete within a certain amount of time. Some examples of velocity metrics are
Cycle time
It doesn’t matter if your engineering team is large or small; cycle time is one of the most essential metrics to track as it is an indicator of speed and quality. It focuses on the time spent on completing any task or part of a task.

You can use this metric to determine the average duration of certain tasks and see if any bottlenecks are slowing you down.
You should aim to compress cycle times as it’s indicative of your team delivering value quickly to end users.
Deployment frequency
Every “top engineering metrics” list is incomplete without deployment frequency. Approved by the DORA researchers, deployment frequency is a measure of an engineering team’s speed and agility. It calculates how often your team releases code to production. This can include pushing new features, bug fixes, and improvements.
Usually, deployment frequency is the first metric monitored by leaders. It’s also straightforward to measure and understand.
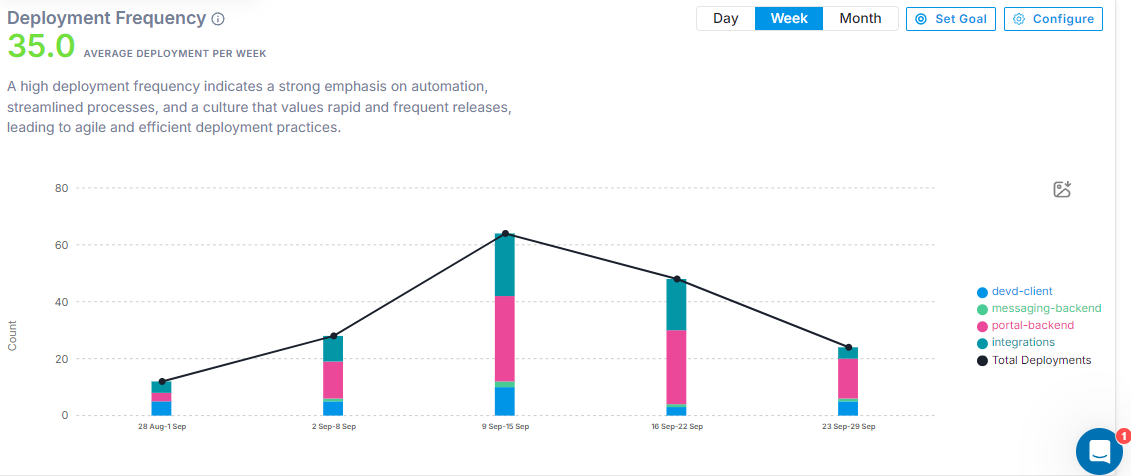
Engineering teams usually aim to release small batches of code frequently because (a) it is significantly easier to manage and test; (b) it enhances the overall code quality.
Lead time
Another unmissable metric in the mix is lead time. It focuses on the entire pipeline from when a change is requested to when it’s delivered to end users.
It’s a must-have because it helps managers understand how smoothly an organization’s engineering processes are going and what modifications need to be made. It also identifies potential delays like slow approvals, wrong prioritizations, and long queues that could hamper velocity.
Engineering operations that lack distinct ownership, clarity, and level of automation may negatively impact lead time. That’s why monitoring the metric over time is crucial to finding chunks in your armor and improving your overall performance.
Team well-being
While some may think morale metrics aren’t that high on the list, it’s still imperative for your team's long-term success and health. A developer’s satisfaction level with their projects and day-to-day responsibilities impacts many facets of an organization - from performance and efficiency to employee retention rates.
That’s why you should keep a pulse on individual and team morale that reflects employees’ engagement, satisfaction, and motivation levels, collected via one-on-one meetings and surveys,
Conclusion
Just like LeBron James, you can be the best in the game if you track the right metrics. Remember that you’ll need to monitor these metrics consistently to derive valuable insights, so don’t get disheartened if you don’t see instant success. Instead, start measuring the metrics and make minor tweaks as you go along, and you will see noticeable improvements over time.
Ready to drive engineering success?